Layout
Overview#
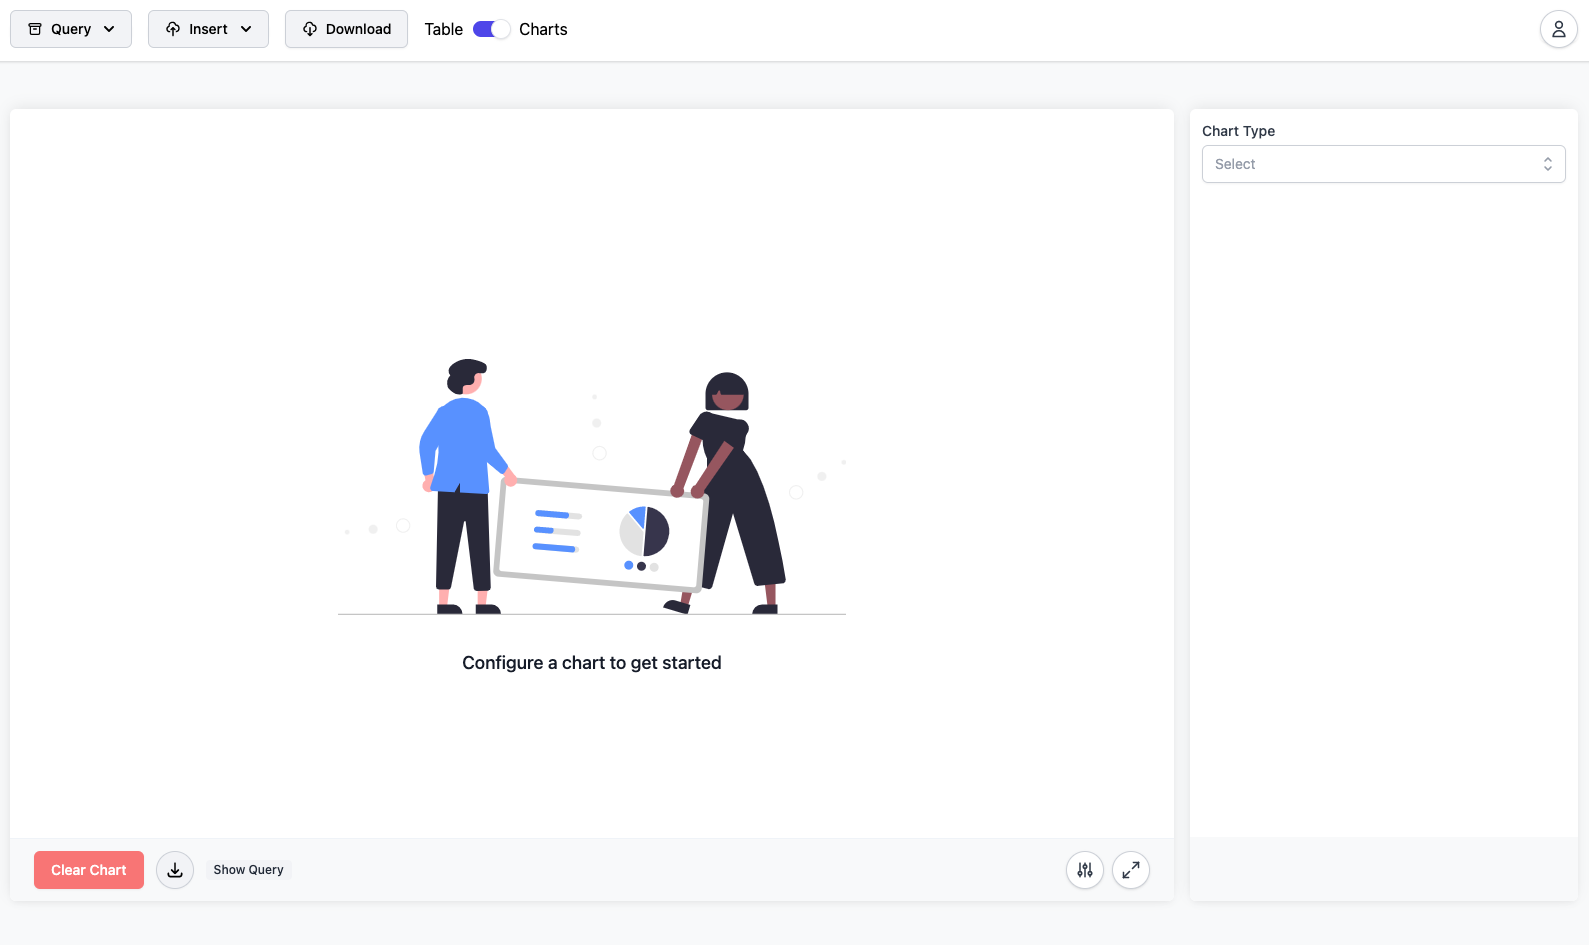
This feature of SpeSQL is still in early development, and as such is subject to change. Not all charts are supported, not all currently supported charts are documented. Treat this section as a living document.The internal layout of the Visualization Page is very similar of that to the Homepage, where there are two major pieces. The left side is where the chart will be rendered, and the right side is where the query is configured.
Available Functions#
Select features are dynamicly changed according to the selected Chart Type. This is because different Chart Types have different configuration and data schemas. For the examples shown below, a simple BarChart configuration is what will be used.
Clear Chart#

This will clear both the data used in the chart as well as the currently rendered chart.
Download Chart Data#

This will download the data used to create the chart as a CSV.
Adjust Chart#

The Adjust Chart button will render a modal which allows for extensive configuration of the chart. Things such as axis labels, colors, titles, etc are all configurable from this modal. Below is the BarChart Adjustment Modal:
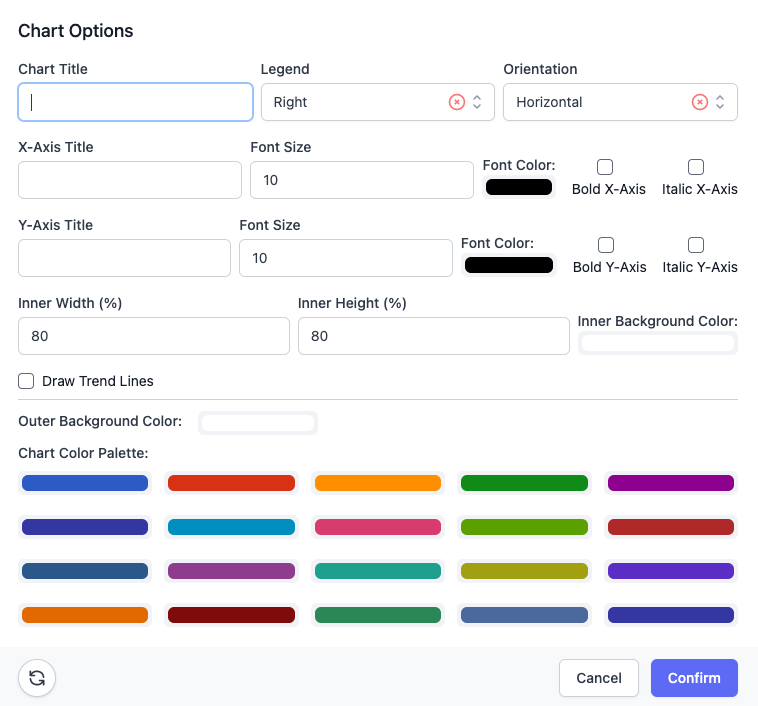
Please note: while the base configuration will be very similar between charts, there will be some that unique, adjustable fields for some charts, and some that are missing adjustable fields.
Maximize/Minimize Chart Window#

The Maximize (or Minimize) button will change the size of the Chart Window to take up the entire inner space. Essentially, the right-hand menu will collapse to make room for the left-hand side.
Configure Chart Query#

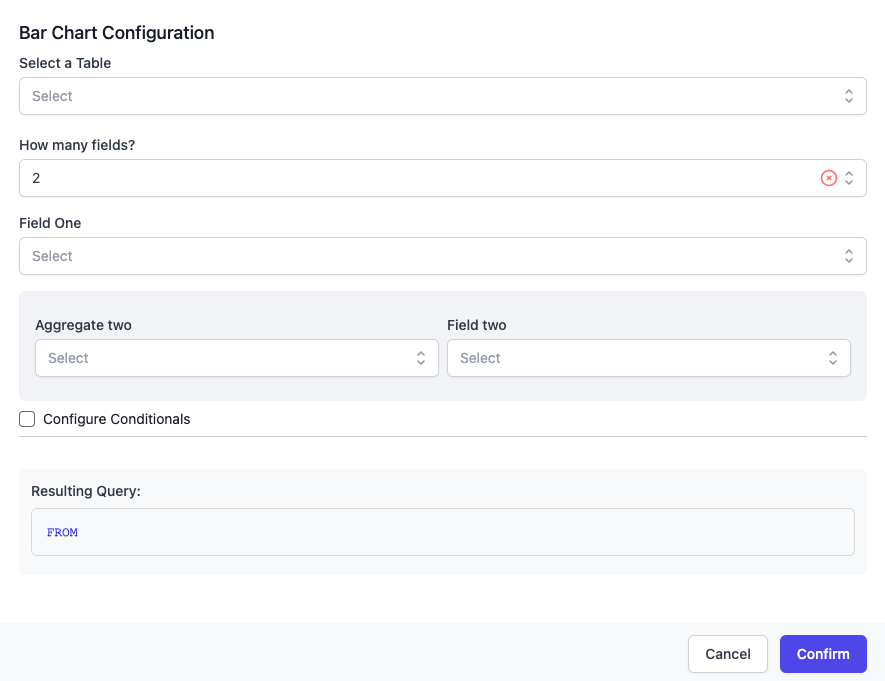
The Configure Query button renders a modal used to construct a query that will allow for the Chart Type data structure to be returned. As such, each chart type will have a slightly different form when the allowed data input differs. More advanced SQL functionalities such as subqueries, unions, etc are not supported in this form. There is an advanced option available (see next heading).
Below is the BarChart Query Config Modal:
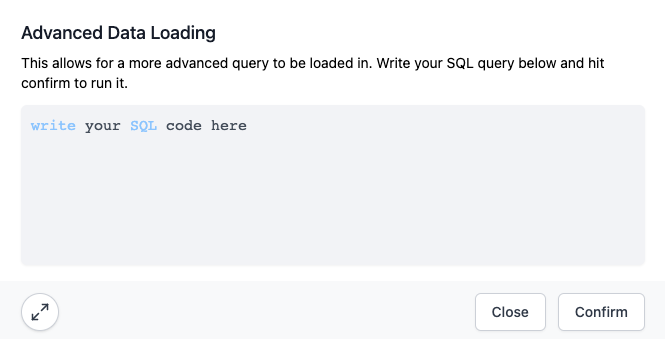
Advanced Configure Chart Query#

Clicking the Scientific Beaker Icon will render the Advanced Query Config modal for the Chart. Here, you may write SQL code directly into the text box. There is syntax highlighting for convenience.